Creating an alert
Every alert is created through the same three-step wizard — Define, Notify, Test — opened from one of three places depending on the alert type.
Where alerts are created
You can start a new alert from three surfaces:
| From | What it creates | How to open |
|---|---|---|
| KPIs page | A KPI alert pre-scoped to that KPI | On a KPI card, select the ⋯ menu → Create alert. From the detail drawer, select the bell icon in the top-right. |
| Metrics library | A Metric alert pre-scoped to that Metric | On a metric row, select the ⋯ menu → Create alert. |
| Alerts page | Any of the three alert types — picked in a dialog | Select CREATE ALERT in the top-right. |
When you open the wizard from a KPI or Metric, the source is locked — the wizard skips the picker and the alert is scoped to that object.
When you open it from the Alerts page, the CREATE ALERT button opens a Select alert type dialog. Pick one of three options and select NEXT to open the wizard:
- Use a KPI — Notify stakeholders on key state changes.
- Use a metric — Trigger alerts against your computed metrics.
- Build custom alerts — Write a custom query.
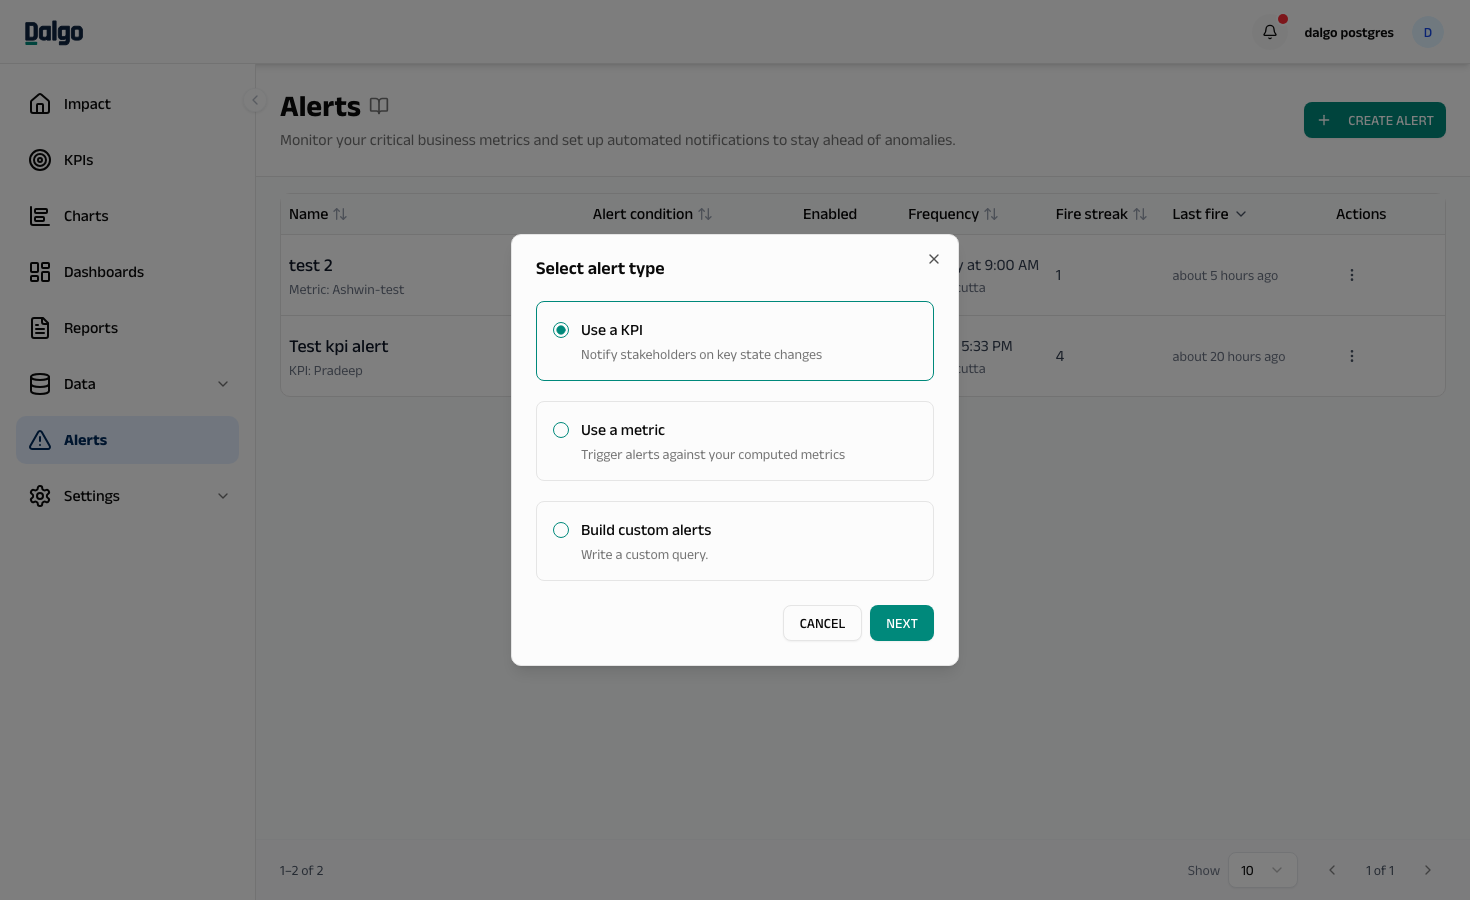
If your organisation has no KPIs yet, the Use a KPI option is disabled and a + Create KPI button appears next to it that takes you to the KPI library. The same applies to Use a metric when the Metrics library is empty. Build custom alerts is always available.
Step 1 — Define
This step covers what the alert measures, what condition fires it, and how often it runs.
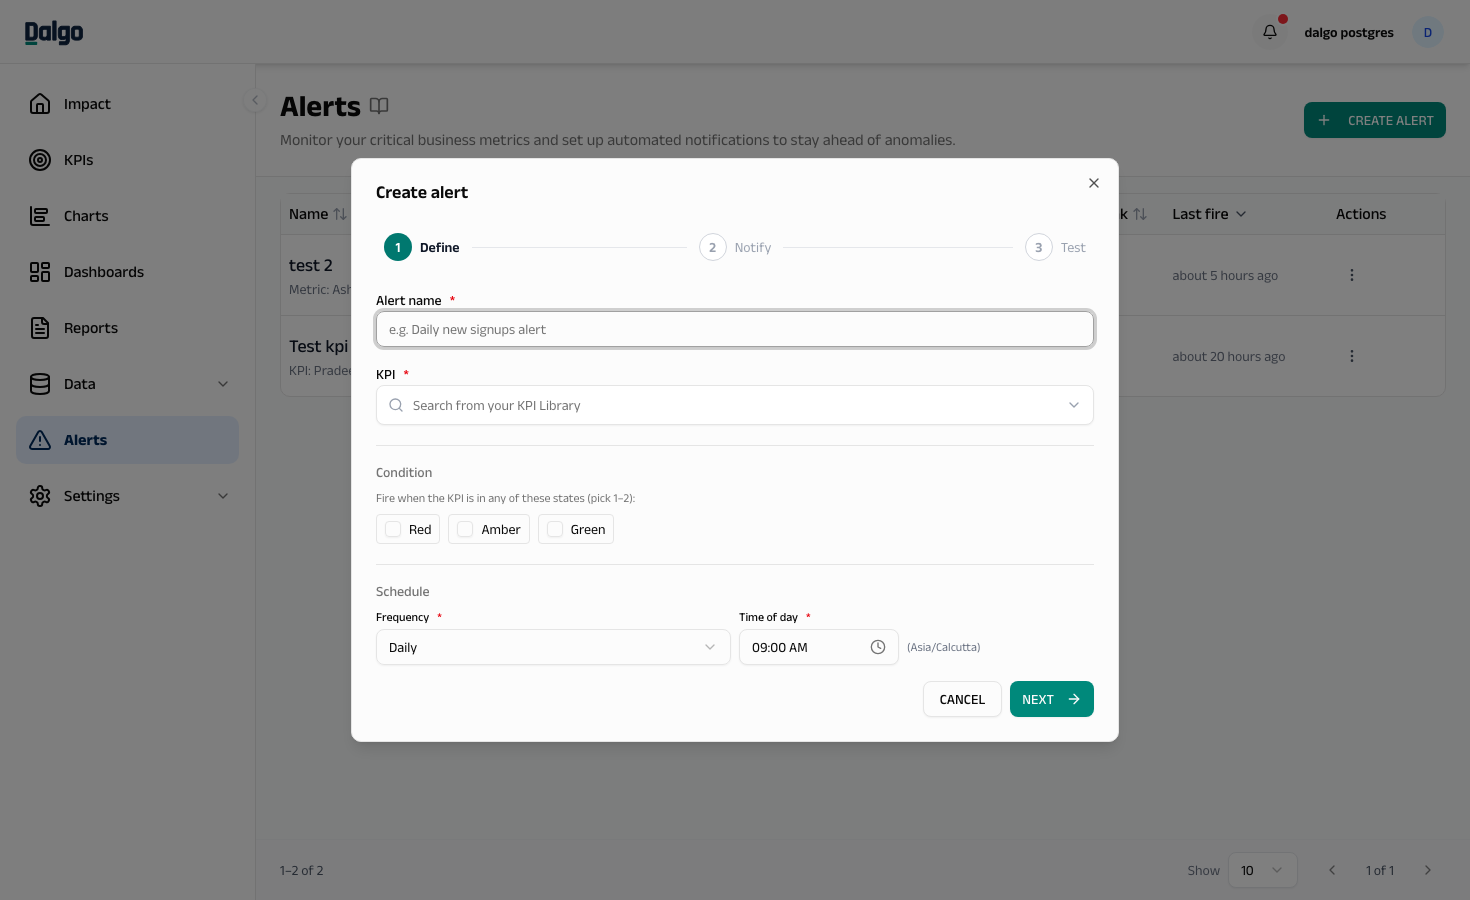
- Enter a Name for the alert. The name must be unique within your organisation.
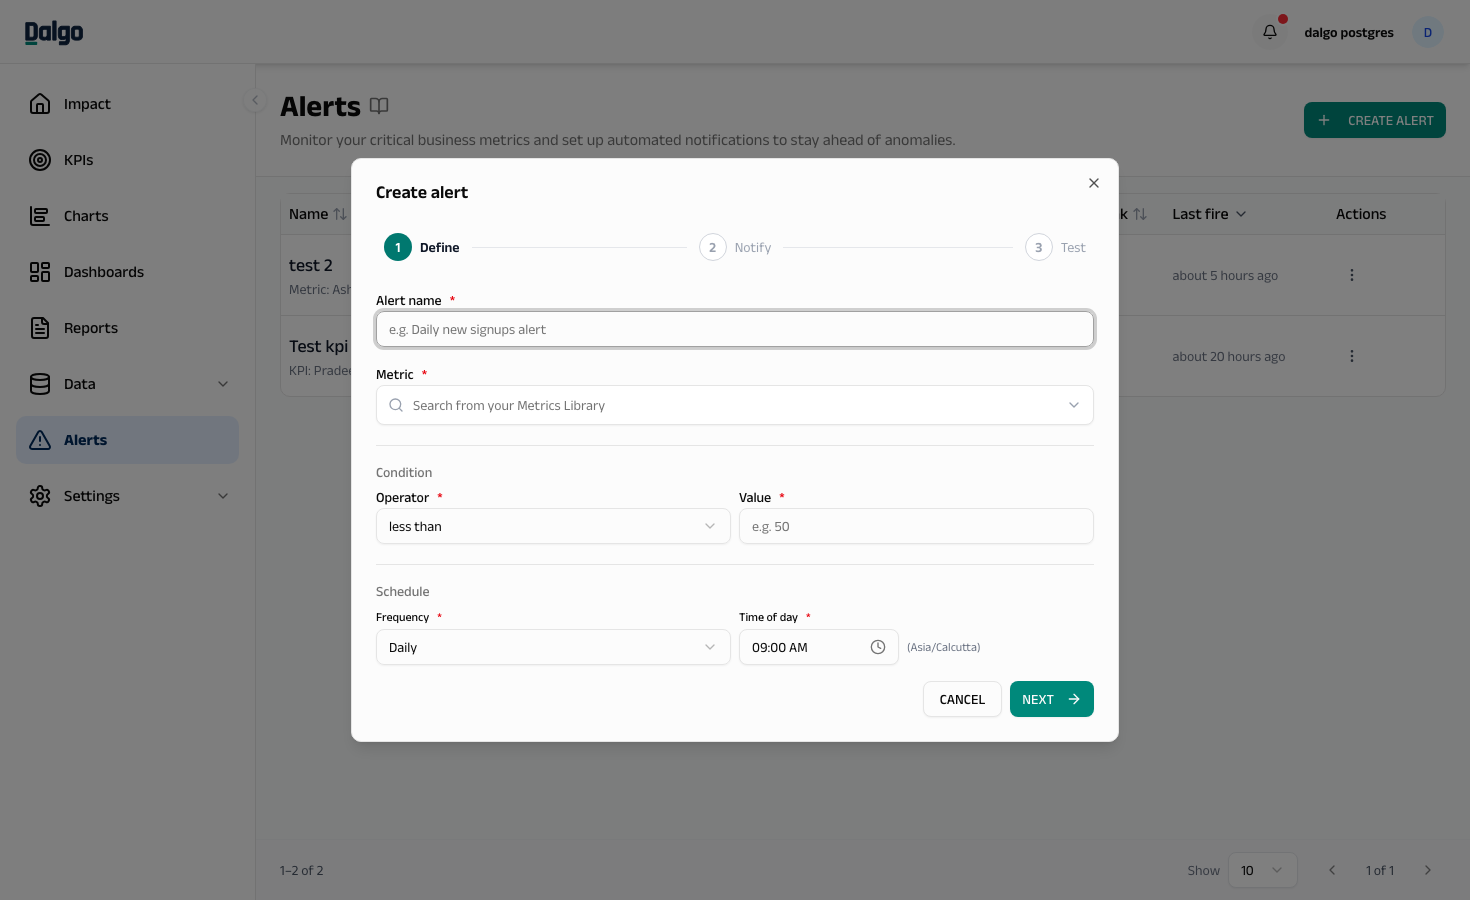
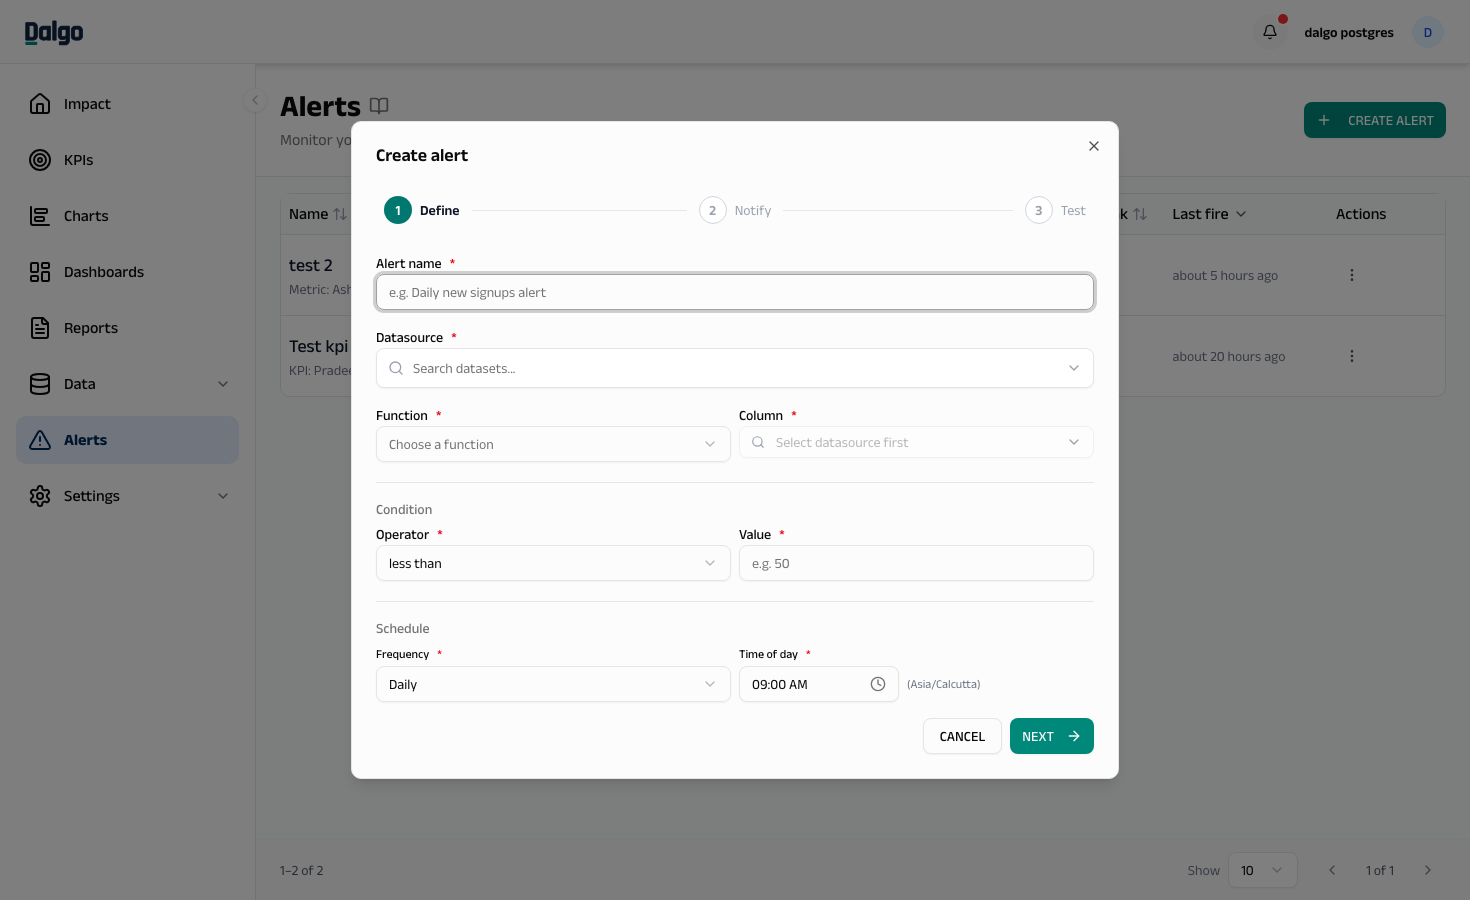
- Set the Source. The fields here depend on the alert type:
- KPI alert — pick a KPI from the KPI dropdown. The card below shows the KPI's target, RAG band percentages, and direction.
- Metric alert — pick a Metric from the Metric dropdown. The line below shows the metric's source table and expression.
- Custom alert — pick a Datasource (schema + table), then a Function (
sum,avg,count,min,max,count_distinct), then a Column. Forcount, the column auto-fills to*(count all rows).
- Set the Condition:
- KPI alert — tick one or two RAG states that should fire the alert (Red, Amber, or Green).
- Metric and Custom alerts — pick an Operator (
is less than,is greater than,is equal to) and a Value.
- Set the Schedule — when the alert runs:
- Frequency — Hourly, Daily, Weekly, or Monthly.
- Time of day — the hour and minute the evaluation runs, in your browser's local timezone. Dalgo converts this to UTC when saving.
- Day of week — only for Weekly schedules.
- Day of month (1–28) — only for Monthly schedules.
- Select Next to continue.
For KPI alerts, you may pick at most two RAG states. To fire on any one of the three states, create three separate alerts or pick the two most important.
Step 2 — Notify
This step covers how the alert reaches your team — by email, by Slack, or both — and what message they receive.
Delivery channels
Tick Email, Slack, or both.
Add recipients by searching for org members, groups, or typing a raw email address. Each recipient appears as a chip. To remove a recipient, select the × on its chip.
- Org members — search by name or email and select from the dropdown.
- Groups — search by group name; the group expands to all active members at the time the alert fires. Members added to the group later automatically receive future firings — no need to edit the alert. Pending invitees (not yet accepted) are skipped at delivery time.
- External email — type a valid email address not in Dalgo and press Enter (or comma) to add it.
A user who appears via multiple paths (direct + group) receives only one notification per firing.
Slack
Paste an Incoming Webhook URL from your Slack workspace. The URL starts with https://hooks.slack.com/services/. Select Send test message to verify Dalgo can post to the channel — you'll see a green confirmation if Slack accepts the request, or the HTTP status and Slack's response if it doesn't.
Slack delivery is per-webhook, not per-recipient. Everyone watching the channel the webhook points to will see the message. To deliver an alert to multiple Slack channels, create a separate alert for each channel.
When you edit an alert, the saved webhook URL is masked for security. Leave the field as-is to keep using the existing URL, or paste a new one to replace it.
Message template
The Message Template is the body that Dalgo sends on every fire. Write it in plain text and insert tokens that Dalgo substitutes with live values at evaluation time.
Available tokens appear as chips above the editor — select a chip to insert it. The token set depends on the alert type:
- All types —
{{alert_name}},{{current_value}},{{evaluated_at}},{{condition}} - Metric and KPI alerts —
{{metric_name}},{{table}} - KPI alerts —
{{kpi_name}},{{target_value}},{{rag_state}} - Custom alerts —
{{aggregation}},{{column}}
For example:
Alert {{alert_name}} fired. Current value is {{current_value}} vs target {{target_value}}.
KPI is in {{rag_state}} state.
Select Next to continue.
Step 3 — Test
The Test step runs the alert once against your live warehouse, without sending a notification, so you can confirm the alert behaves the way you expect.
A status pill at the top shows one of three outcomes:
- Alert will fire for current data — the condition is met right now. The alert will notify recipients on its next scheduled run.
- Alert will not fire for current data — the condition is not met. Dalgo still evaluates on schedule; the alert just stays silent until the data crosses the threshold.
- No data available — current value is empty — the query returned no rows. Re-check your data source or the time window you care about.
Below the pill, three panels show the dry-run details:
- Result — the current value the query returned and the threshold condition for comparison.
- Message Preview — the rendered message, with tokens substituted from the dry-run values. This is exactly what your recipients will see when the alert fires.
- View generated Sql — expandable accordion showing the SQL that ran. Useful for debugging unexpected values or sharing with your data team.
If you change a setting in steps 1 or 2 and return to step 3, the dry-run re-runs automatically.
When you're satisfied, select Create alert at the bottom right. The alert is saved and will run on its next scheduled tick.
Editing an alert
From the alert row's ⋯ menu, select Edit. The wizard reopens with all three steps prefilled. The alert type and its source (KPI, Metric, or dataset) are locked; the name, condition, schedule, delivery channels, recipients, and message template can all be changed.
Select Save changes in step 3 to save.
Next: Alerts overview · KPIs · Metrics