Alerts
Alerts notify you by email or Slack when your data crosses a threshold you care about — a KPI going red, a Metric dropping below a number, or a custom check on any table in your warehouse.
An alert is a saved rule. Dalgo evaluates it on a schedule you set, and notifies your chosen recipients whenever the rule fires. Every evaluation is logged so you can see what ran, what value came back, and who received the message.
The Alerts page
Select Alerts in the left menu to open the alert list.
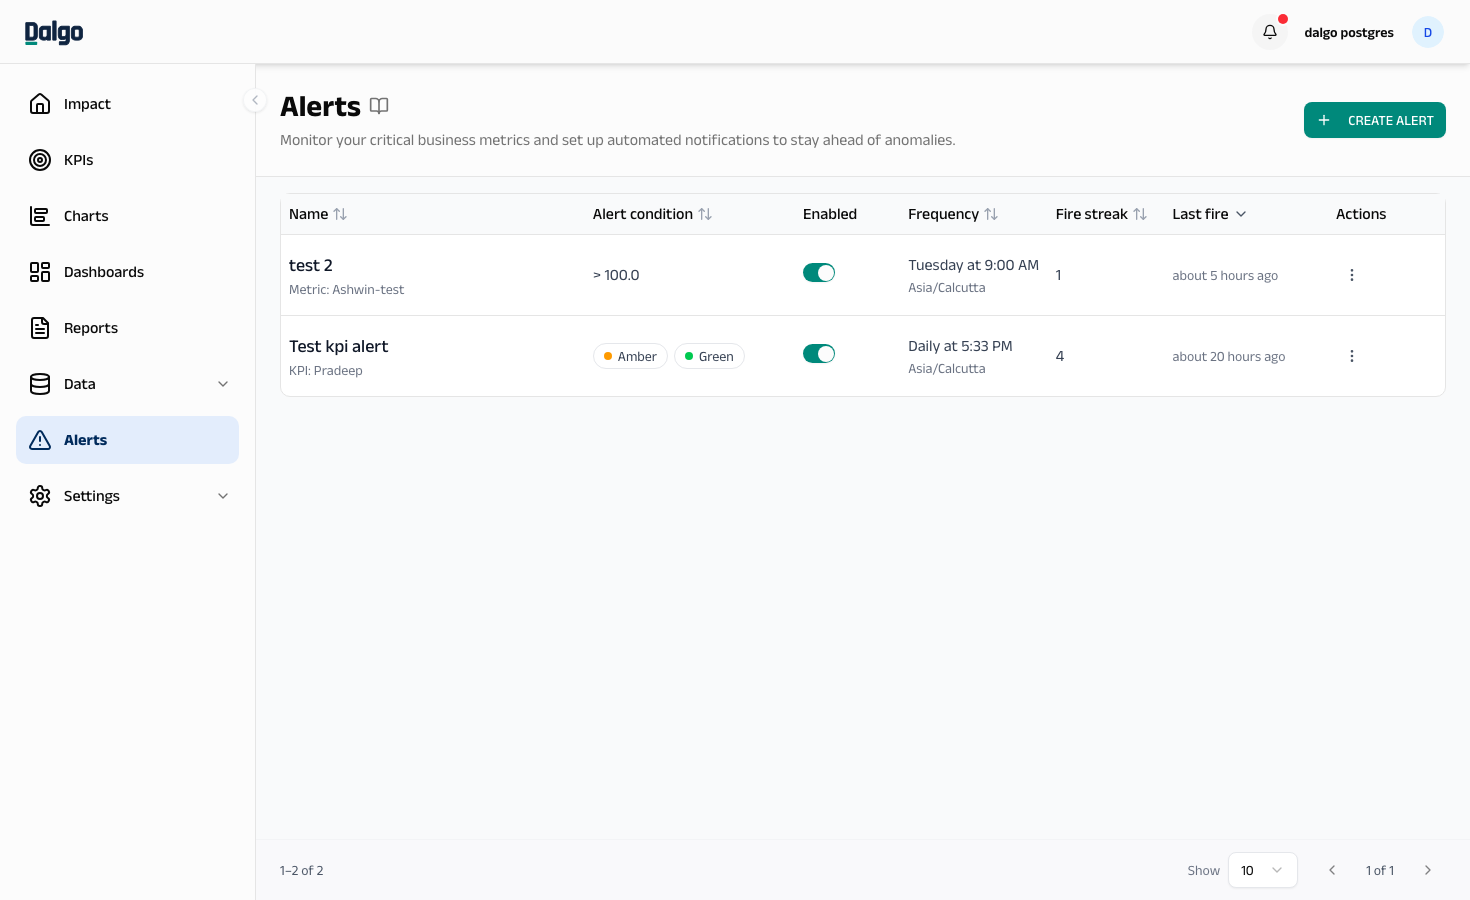
Each row shows:
- Name — the alert name. The line below shows the linked KPI, Metric, or dataset; selecting it opens the source.
- Alert condition — for Metric and Custom alerts, the operator and threshold (e.g.
< 500). For KPI alerts, one or more RAG state chips (Red / Amber / Green). - Enabled — toggle the alert on or off. A disabled alert is not evaluated and does not notify.
- Frequency — when the alert runs (Hourly, Daily, Weekly, Monthly) in your local timezone.
- Fire streak — how many consecutive evaluations have fired. Resets to 0 when the alert next evaluates without firing.
- Last fire — relative time since the alert most recently fired.
Sort by any of the column headers. The list is paginated — change the page size with the dropdown at the bottom right.
Alert types
Dalgo supports three alert types. The type is picked when you create the alert and cannot be changed afterwards.
| Type | What it checks | Best for |
|---|---|---|
| KPI alert | A linked KPI is in one or two RAG states you select (e.g. fire when red or amber) | Leadership-facing indicators with targets and RAG bands |
| Metric alert | A linked Metric crosses a numeric threshold (less than / greater than / equal to) | Operational thresholds on saved measurements |
| Custom alert | An ad-hoc aggregation on any warehouse table, with optional filters, against a numeric threshold | Data-quality checks, row counts, or measurements that are not in your Metrics library |
See Creating an alert for the three entry points and the wizard.
Row actions
Select the ⋯ menu at the end of any row to:
- Edit — reopens the wizard with all three steps prefilled. The alert type and its source (KPI / Metric / dataset) are locked; everything else can be changed.
- Alert log — opens the evaluation history for this alert (see below).
- Delete — removes the alert.
Deleting an alert is permanent. The alert's evaluation history is removed with it.
Viewing the alert log
The alert log shows every time the alert ran, whether it fired, what value the query returned, and the SQL that was executed. Open it from the row's ⋯ menu → Alert log.
Each row in the log shows:
- Time — when the evaluation ran, with a relative timestamp underneath.
- Current value — the number returned by the query (or
—if the query returned no rows). - Channel · Recipients —
Email,Slack, orEmail · Slack, plus the first two recipient addresses with an overflow count. - Status — whether each delivery was sent or failed (with the HTTP status code if Slack rejected it).
Expand any row to see the rendered message that was sent, the per-recipient delivery status, and the SQL that ran.
The log records every evaluation, including non-fires. The rendered message field is always populated so you can see what would have been sent if the alert had fired.
Permissions
Three permissions control who can do what with alerts:
- View Alerts — read the list and open the alert log.
- Create Alerts — opens the CREATE ALERT button and the Create alert menu items on KPI cards and Metric rows.
- Edit Alerts — needed to toggle the Enabled switch and to use the Edit action.
- Delete Alerts — needed to use the Delete action.
Permissions are assigned per-role in Access.
Next: Creating an alert · KPIs · Metrics