Metrics
Metrics are reusable measurements — a saved combination of a column and an aggregation — that power your KPIs and charts.
Defining a measurement once and reusing it everywhere keeps numbers consistent across your team. When the definition of "Active beneficiaries" lives in the Metrics library, every chart, KPI, and report that references it stays in sync.
The Metrics library
Select Data in the left menu, then select Metrics.
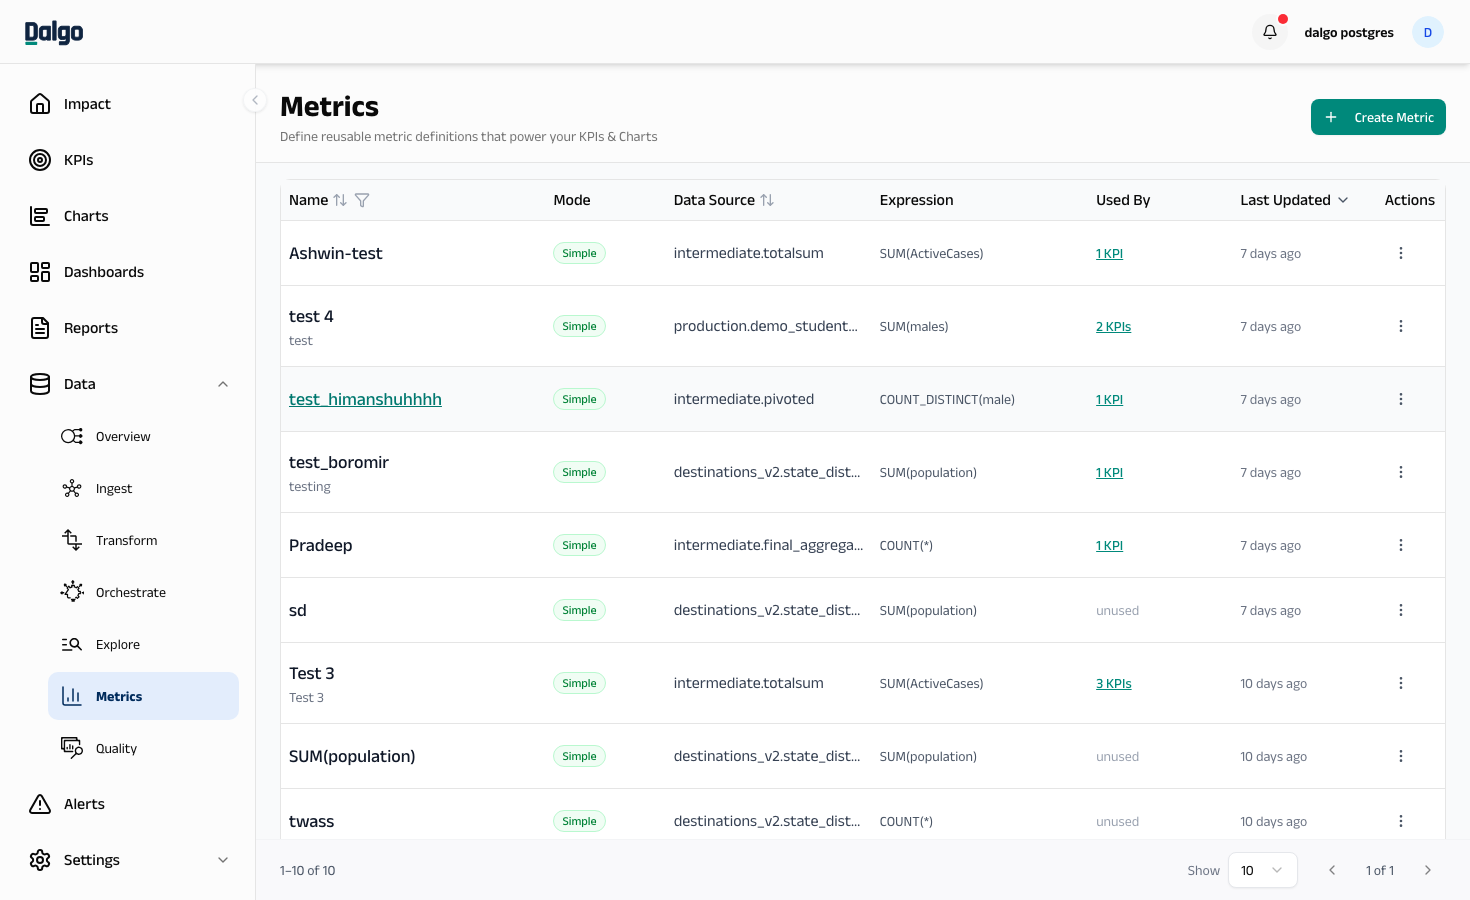
The library lists every metric defined for your organisation, with columns for:
- Name — the metric name and a short description.
- Mode — Simple (column + aggregation) or Calculated (SQL expression).
- Data source — the schema and table the metric reads from.
- Expression — a preview of how the value is computed (e.g.
SUM(amount)orCOUNT(*)). - Used by — the number of charts and KPIs that reference this metric. Select the count to see a list.
- Last updated — when the definition last changed.
Use the Name column header to filter or sort, and the Data source and Last updated headers to sort.
Creating a metric
- Select + Create Metric in the top-right.
- Enter a Name — this is what your team will see in chart and KPI pickers.
- Add an optional Definition describing what the metric measures.
- Pick a Data source — the warehouse schema and table the metric reads from.
- Choose a mode:
Simple mode
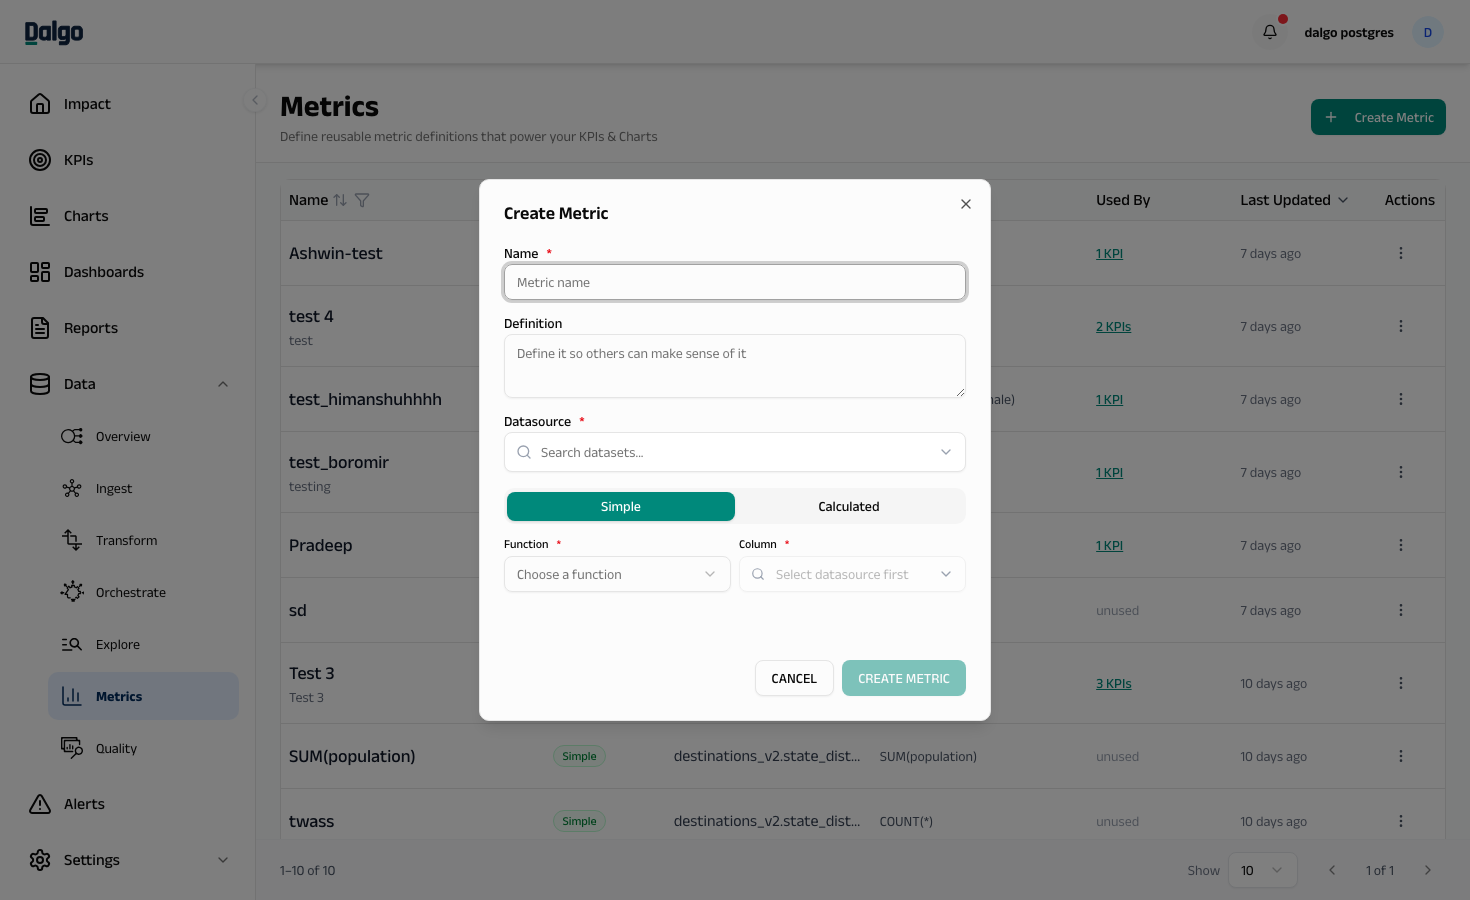
Pick a built-in aggregation and a column.
- Function —
sum,avg,count,min,max, orcount_distinct. - Column — the column to aggregate. For
count, the column auto-fills to*(count all rows). For numeric aggregations (sum,avg,min,max), only numeric columns are listed.
Calculated mode
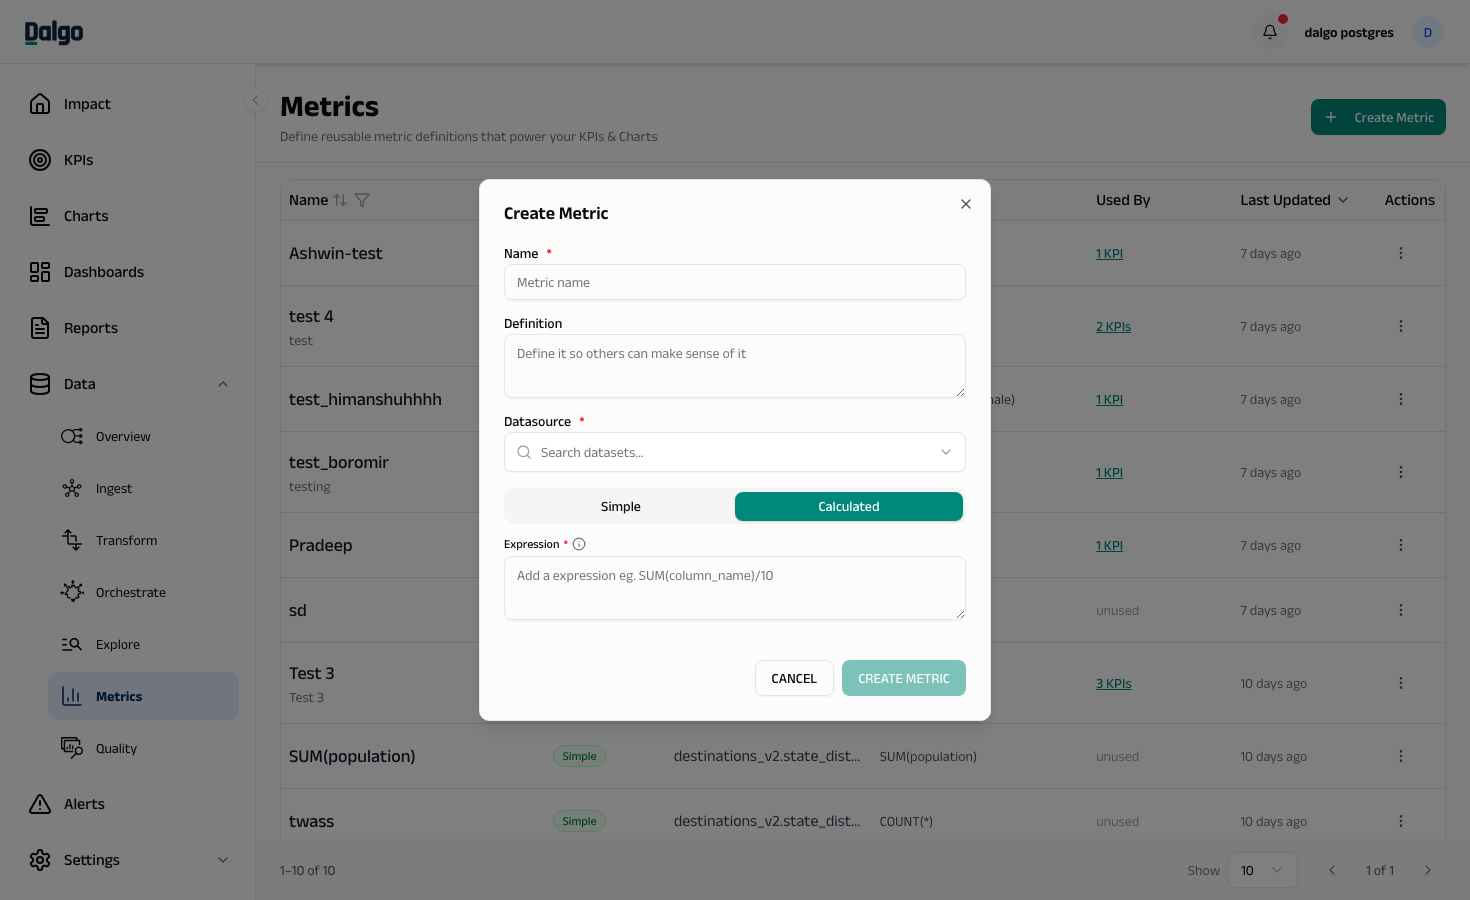
Write a SQL expression that returns a single numeric value — useful for ratios, weighted averages, or anything Simple mode can't express.
- Example:
SUM(amount_paid) / NULLIF(SUM(amount_due), 0)for collection rate. - The expression runs against your warehouse when you save. You'll see Expression valid if it works, or the database error if it doesn't.
- Select Save to add the metric to the library.
Editing a metric
Select the metric name or use the ⋯ menu and choose Edit Metric.
If the metric is already used by charts or KPIs, editing its definition changes what those visuals show. The edit dialog shows you which charts and KPIs depend on this metric before you save.
Deleting a metric
Use the ⋯ menu on the row and select Delete. Deletion is blocked while charts or KPIs still reference the metric — remove those dependencies first.
Promoting a metric to a KPI
From any metric row, use the ⋯ menu and select Create KPI. The KPI form opens with the metric pre-selected — you only need to add a target, RAG thresholds, and a time grain. See Creating a KPI.