Creating a KPI
Every KPI is built on top of a saved Metric. Before you create a KPI, make sure the underlying measurement exists in your Metrics library.
Creating a new KPI
- Select KPIs in the left menu.
- Select + Create KPI (or Create your first KPI if the library is empty).
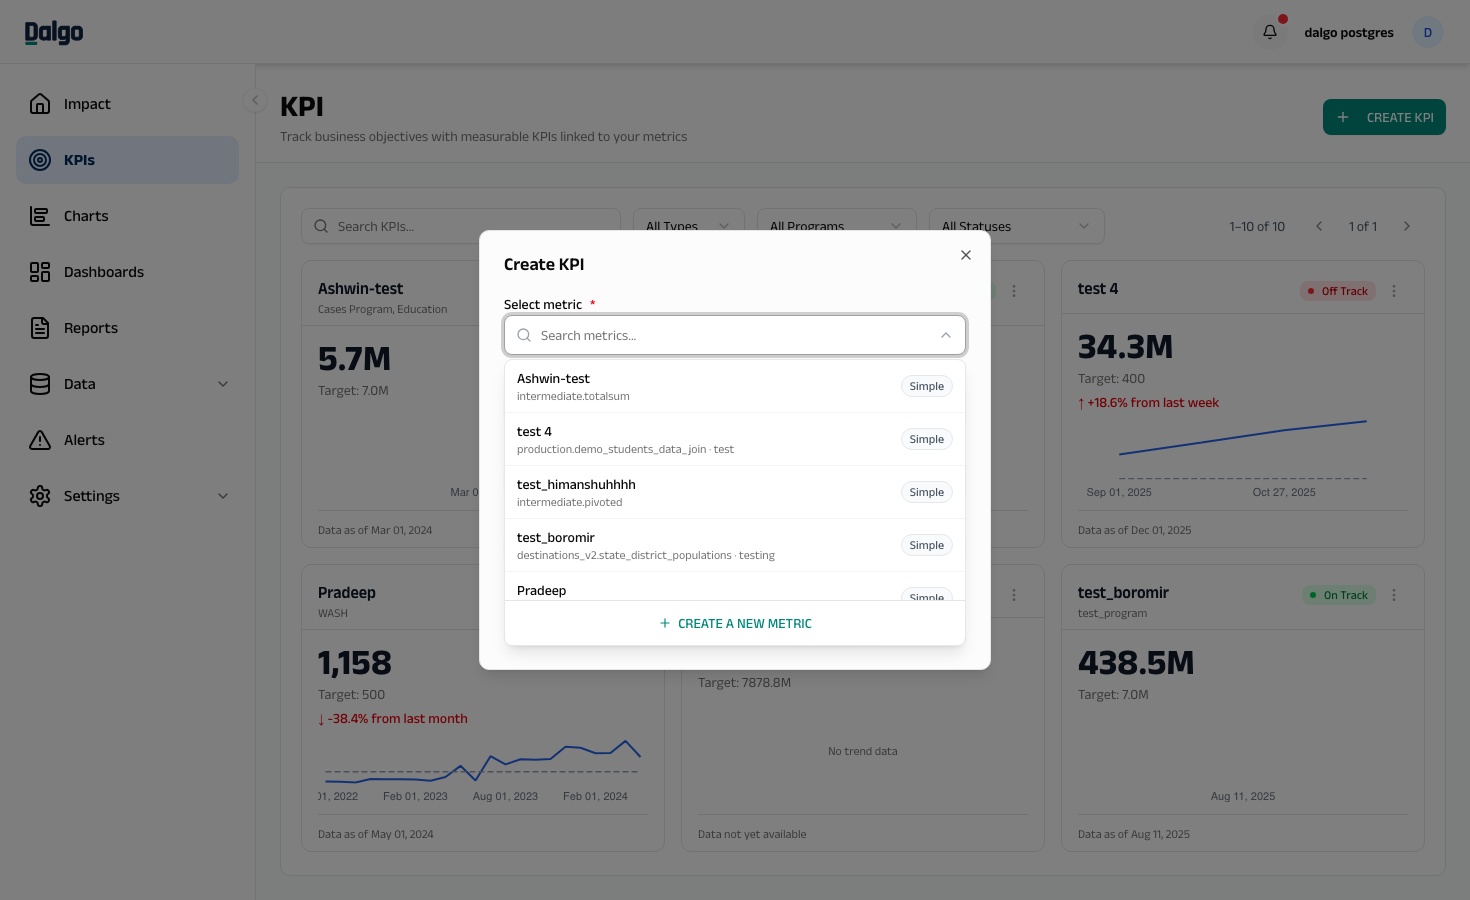
Step 1 — Metric, name, target, direction
- Open the Select metric dropdown and pick a metric from your Metrics Library. Each entry shows the metric name, its data source, and whether it is a Simple or Calculated metric.
- The Name this KPI field auto-fills with the metric name. Edit it if you want a different label on the card.
- Enter a Target Value — the number you want this KPI to reach.
- Choose a Direction:
- Higher is better — the KPI should increase toward the target (e.g. students enrolled).
- Lower is better — the KPI should decrease toward the target (e.g. dropout rate).
- Select Continue.
If the metric you need doesn't exist yet, select + Create a new metric at the bottom of the metric dropdown to open the Metrics library in a new tab.
Step 2 — RAG status, time period, classification
This step controls how the KPI is colour-coded and what time grain it tracks.
Target & RAG status
Set the thresholds for each status as a percentage of your target. The card colour and badge update live as values move across these bands.
- On Track (green) — defaults to 100% or more of target.
- Needs Attention (amber) — defaults to 80% or more of target (or 120% or less, if direction is "Lower is better").
- Off Track (red) — anything outside the amber band; calculated automatically.
The form shows the absolute value next to each percentage so you can sanity-check the bands.
Time configuration
- Time column — the date or timestamp column from the metric's table that periods are bucketed by.
- Time grain — Daily, Weekly, Monthly, Quarterly, or Yearly. The trend chart and period-over-period change use this grain.
Classification (optional)
- Program tags — type a tag and press Enter or comma to add it. Existing tags appear as suggestions. Use these to group KPIs by program in the filter bar.
- KPI type — pick one of Input, Output, Outcome, or Impact. Use these to follow your team's results framework.
- Select Create KPI to save.
The new KPI appears on the KPI page with a status badge and trend chart, once the underlying metric has data for the chosen time column.
Editing a KPI
- Select the ⋯ menu on the KPI card and choose Edit KPI.
- Update any field and select Save KPI.
The linked metric, time column, and time grain cannot be changed after a KPI is created. To change any of these, delete the KPI and create a new one.
Editing the target value recolours historical RAG status — the trend chart re-evaluates every period against the new thresholds.
Next: Notes and drilldown · KPIs overview · Metrics