Notes and drilldown
Open a KPI card to see a larger trend chart and add notes — short comments or beneficiary quotes attached to a specific time period.
Notes give context to the numbers. When a KPI dipped in March because a flood disrupted field work, write that down on the March period. Reviewers see the note next to the value and don't have to ask.
Opening the drilldown drawer
- Select KPIs in the left menu.
- Select a KPI card.
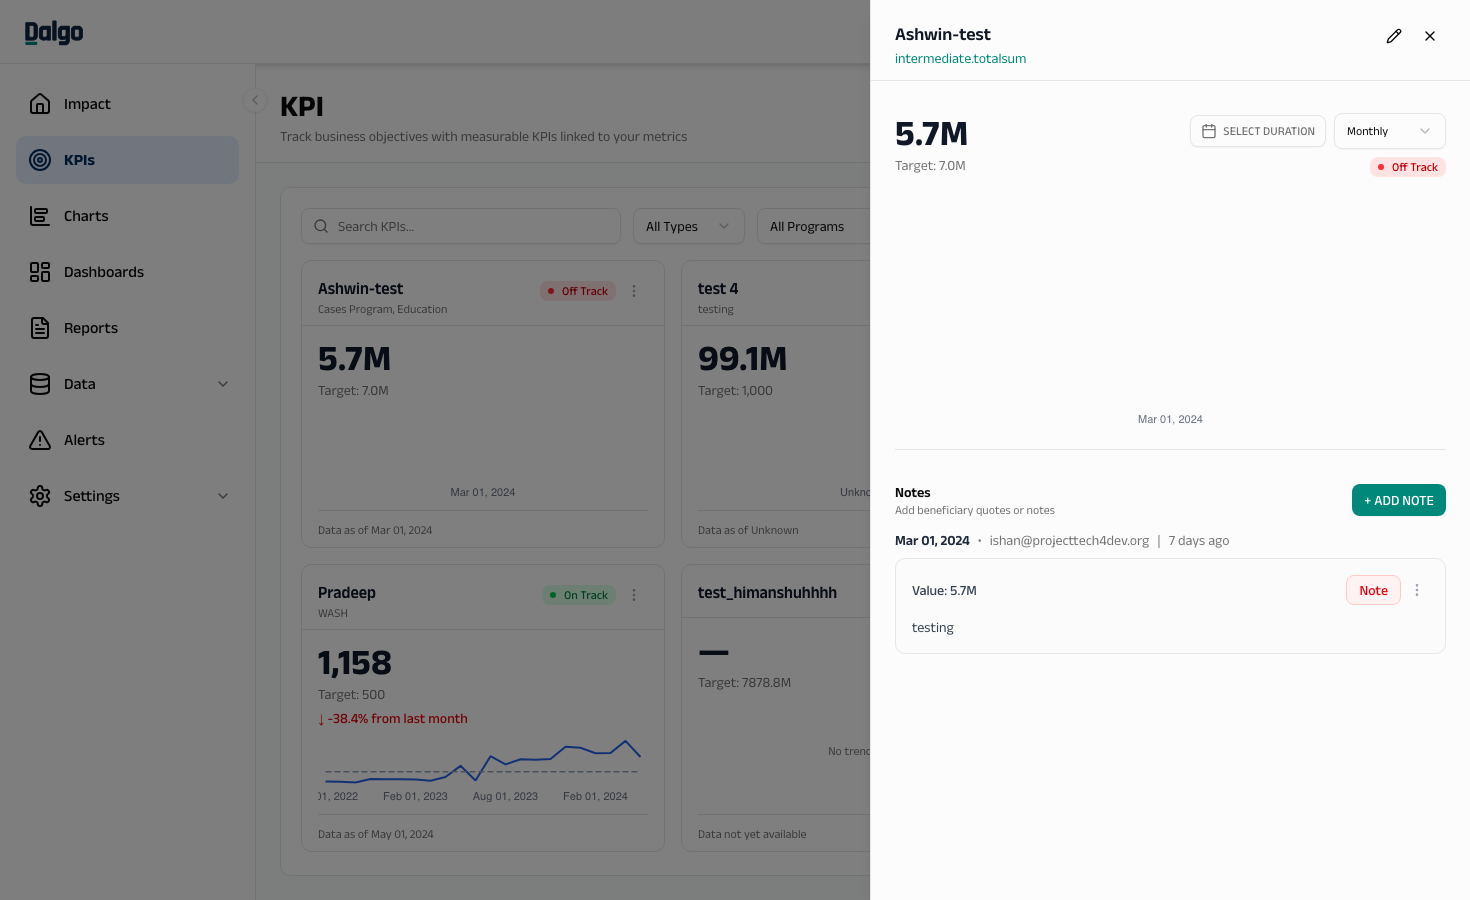
The drawer opens from the right of the screen and shows:
- The KPI name and a link back to the underlying metric.
- A larger trend chart with the same RAG colours.
- The current value, target, and period-over-period change.
- A Notes timeline below the chart.
Changing the view
Inside the drawer you can adjust how the trend chart is displayed without changing the KPI definition itself:
- Date range — pick a custom range or a preset such as Last 90 days or Year to date.
- Time grain — switch between Daily, Weekly, Monthly, Quarterly, or Yearly to zoom in or out.
These choices only affect the drawer view. The KPI card on the main page keeps its saved time grain.
Adding a note
Notes are tied to a specific period — for example, "Q2 2025" if the time grain is Quarterly.
- In the drawer, select + Add Note.
- Choose the period the note applies to.
- Pick a note type:
- Note — general commentary.
- Beneficiary Quote — a quote from someone the program served.
- Write the note text and select Save.
The note appears in the timeline alongside the value and period-over-period change for that period.
Notes capture a snapshot of the KPI value at the time you write them. If the underlying data is later corrected, the note keeps the original value so you can see what was true when the comment was made.
Editing and deleting notes
Use the ⋯ menu on any note to edit or delete it. Deletions are immediate and cannot be undone.
Next: KPIs overview · Creating a KPI · Dashboards