Creating a chart
Charts are created from a dataset — a table in your warehouse — and then added to dashboards.
Creating a new chart
- Select Charts in the left menu.
- Select + New Chart.
- Choose a chart type. See Chart types for guidance on which to use.
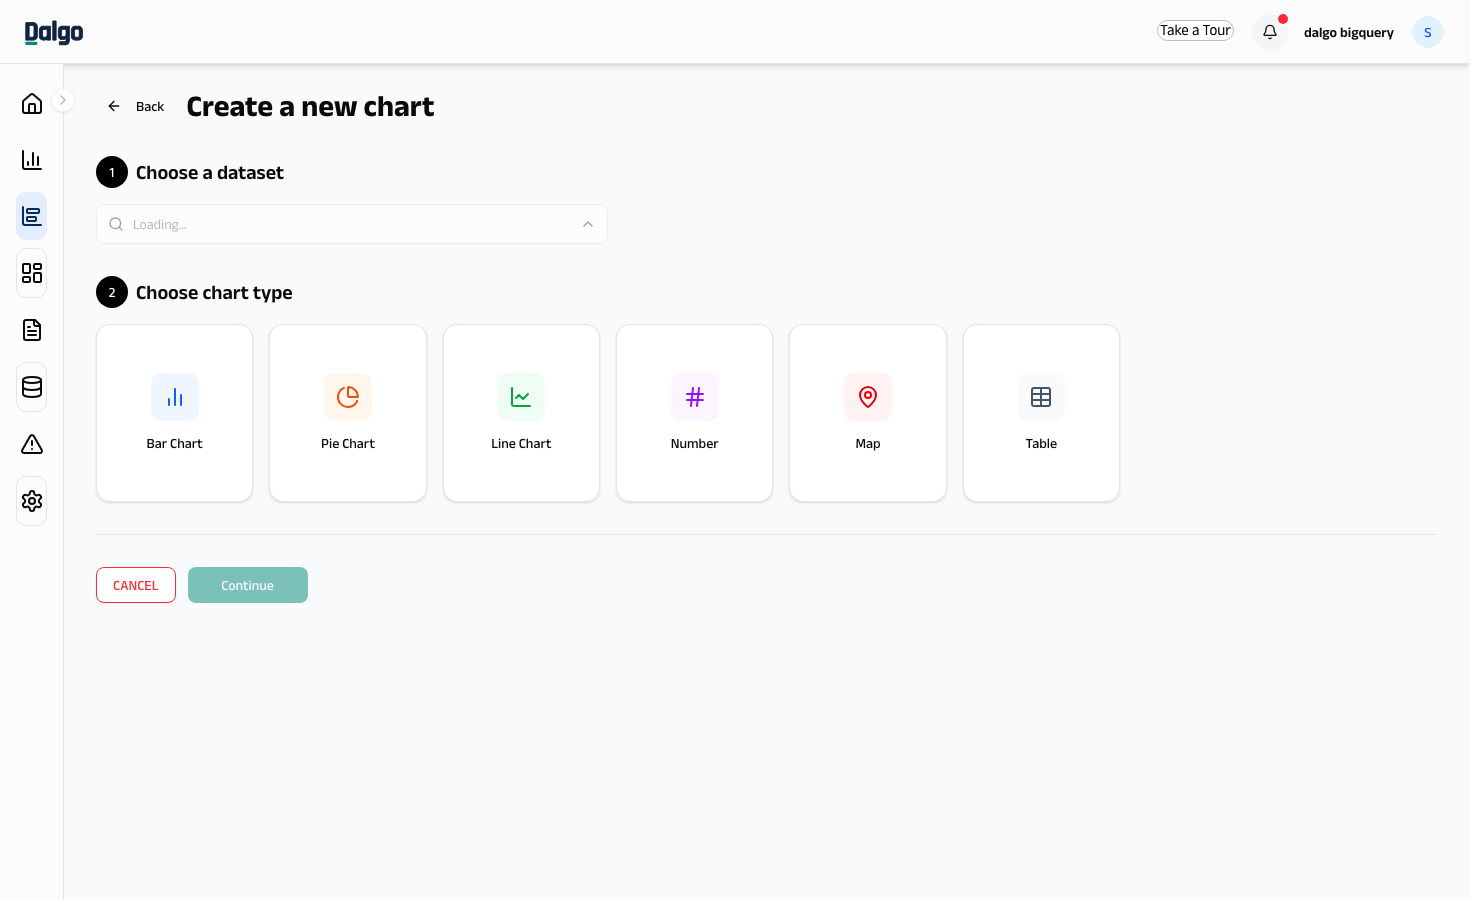
- Select the dataset (the warehouse table) your chart will draw from.
- Select Configure.
- In the configuration screen, choose which columns to use for axes, values, filters, and labels.
- Give your chart a name.
- Select Save.
The chart is now saved and available to add to any dashboard.
Using a saved metric
The right-hand Data panel has a Metrics section where you define what the chart measures. Select + Add another metric to open the metric form. The form has three tabs:
- Simple — pick an aggregation (sum, avg, count, etc.) and a column from the dataset.
- Calculated — write a SQL expression that returns a single number.
- Saved — pick from your Metrics library.
To use an existing metric, switch to the Saved tab and select one from the dropdown labelled Select a metric from pre-defined list. The chart now shows the saved metric's definition, and any future edit to the metric flows through to this chart automatically.
You can mix saved and ad-hoc metrics in the same chart — bar, line, and table charts accept multiple metrics, while pie, number, and map charts use one.
A small library icon next to a metric's label means it is a saved metric. Hover over it to see the metric name.
If you build a metric in Simple or Calculated mode and want to reuse it elsewhere, expand the Add metric to library section in the metric form and select Add metric to library — the metric is saved and added to the chart in one step.
Editing a chart
- Select Charts in the left menu.
- Find the chart you want to edit and select the ⋯ menu on its row.
- Select Edit.
- Make your changes and select Save.
Deleting a chart
- Select Charts in the left menu.
- Select the ⋯ menu on the chart row.
- Select Delete.
Deleting a chart removes it from all dashboards that use it. This cannot be undone.